Datadog
There are two package for datadog write by Go.
- dd-trace-go
- This is for tracing
- datadog-go
- This is for metric
There is no log package for datadog, since it collect from file or stdout.
Datadog Terminology
Agent
we need send data to agent, then the agent send data to datadog.

- Collector
- DogStatsD
- Forwarder
StatsD
if originally a simple daemon developed and released by Etsy to aggregate and summarize application metrics.
With StatsD, applications are to be instrumented by developers using language-specific clients libraries. These libraries will then communicate with the StatsD daemon using its dead-simple protocal, and the daemon will then generate aggregate metrics and relay them to virtually any graphing or monitoring backend.
- Datadog embedded StatsD daemon within the Datadog Agent
- Datadog extended the StatsD protocal to support tagging
DogStatsD
Datadog accept all three of the major Datadog data types: metrics, event, service checks. In version 6, DogStatsD is a Golang implementation of Etsy’s StatsD metric aggregation daemon. It is used to receive and roll up arbitary metrics over UDP or Unix socket, thus allowing custom code to be instrumented without adding latency.
dd-trace-go
profiler
This is for sending data like CPU, MEM for datadog. A profiler shows how much “work” each function is doing by collecting data about the program as it’s running. For example, if infrastructure monitoring shows your app servers are using 80% of their CPU, you may not know why. Profiling shows a breakdown of the work, for example:
| FUNCTION | CPU USAGE |
|---|---|
| doSomeWork | 48% |
| renderGraph | 19% |
| Other | 13% |
- setup
1 | go get gopkg.in/DataDog/dd-trace-go.v1/profiler |
- code
1 | import "gopkg.in/DataDog/dd-trace-go.v1/profiler" |
then you are done, the profiler will send the data automatically.
ddtrace
This is for sending tracing data to datadog.
- setup
1 | go get gopkg.in/DataDog/dd-trace-go.v1/ddtracer |
- code
1 | func main() { |
There also other options like
- ServiceMapping
- HTTPClient
- UDS
- RuntimeMetrics
- ServiceVersion
- …
ddtrace/tracer
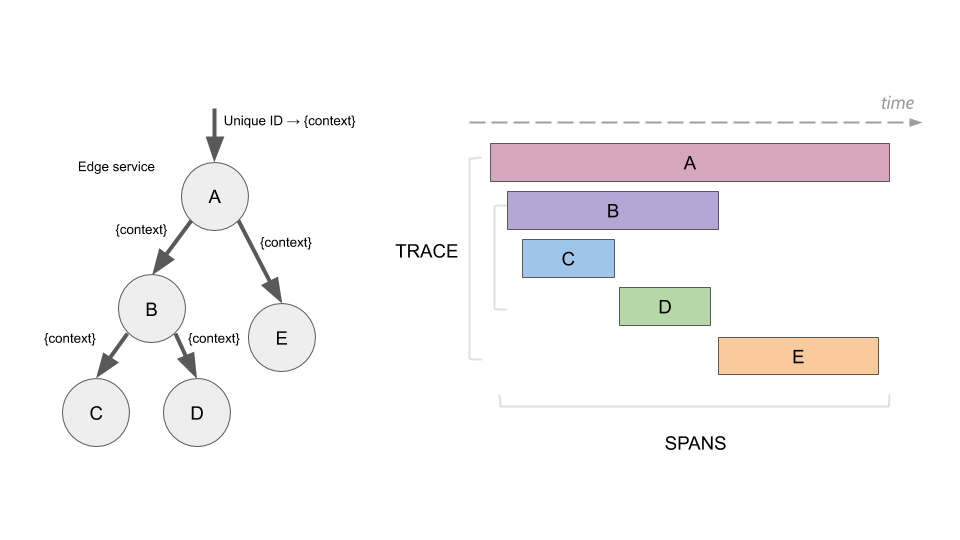
There is a concept called span. span is like a tree. we can have child span, parent span.

Bscially we can consider span as a node with some tags.
1 | // Start a root span. |
if we want to create a child span
1 | // Create a child of it, computing the time needed to read a file. |
we have 3 way to create span
StartSpanFromContext- if span is in context, the span will become parent span, otherwies start new span.
SpanFromContext- get span from context
StartSpan- start a new root span
we can set span to context
1 | ctx = ddtracer.ContextWithSpan(ctx, span) |
we can set tag for span, this can be seen from the dashboard. span use tag to carry message.
1 | span, ctx := ddtracer.StartSpanFromContext(ctx, "span.name" |
ddtrace/ext
This is a package for some common constant, for example
1 | AppTypeWeb = "web" |
we can use it in SetTag or other place.
ddtrace/tracer sampling
The tracing client can perform trace sampling. While the trace agent already samples traces to reduce bandwidth usage, client sampling reduces performance overhead. To make use of it, the package comes with a ready-to-use rate sampler that can be passed to the tracer. To use it and keep only 30% of the requests, one would do:
1 | s := tracer.NewRateSampler(0.3) |
More precise control of sampling rates can be configured using sampling rules. This can be applied based on span name, service or both, and is used to determine the sampling rate to apply.
1 | rules := []tracer.SamplingRule{ |
contrib
This package contain some already written code used to tracing some common service/library like
- GCP PubSub
- Gin
- Gorm
- net/http
datadog-go
datadog-go is a library that provides a DogStatsD client in Golang. DogStatsD accepts custom metrics, events, and service checks over UDP and periodically aggregates and forwards them to Datadog. DogStatsDis already enabled by defaul at agent. Here we use this pakcage send data to agent.