Systems Performance
Systems Performance studies the performance of an entire computer system
Goal: improve the end-user experience by reducing
latency and to reduce computing cost.
- latency
- cost
- eliminating inefficiencies
- improving system throughput
- general tuning
Role
- system administrators
- site reliability engineers
- application developers
- network engineers
- database administrators
- web administrators
- other support staff
role should focuse on that role’s area of responsibility
Activities
- development
- Setting performance objectives
- Performance characterization of POC
- dev Performance analysis
- Non-regression testing
- Benchmarking
- prod
- prod proof-of-concept testing
- prod performance tuning
- prod monitoring
- prod performance analysis
- prod incident reviews
- enhance production analysis
Perspectives
There are two common perspectives for performance analysis
Resource Analysis
Resource analysis begins with analysis of the system resources: CPUs, memory, disks, network interfaces, buses, and interconnects. I
- Performance issue investigations
- Capacity planning
like SRE, platform level
- IOPS
- Throughput
- Utilization
- Saturation
Workload Analysis
Workload analysis examines the performance of applications: the workload
applied and how the application is responding
like engineer, application level
- Requests: The workload applied
- Latency: The response time of the application
- Completion: Looking for errors
Why Performan different
Subjectivity
Develop a software can be objective, but performance can be subjective, since there always something to improve. and is the value enough?
the latency is 100ms
Is hard to decide 100ms is good or bad. may depend on the performance expectations of the application developers and end users.
Subjective performance can be made objective by defining clear goals
Trade Offs
pick two
- good/fast/cheap
- high-performance/on-time/inexpensive
When to Stop
- When you’ve explained the bulk of the performance problem
- When the potential ROI is less than the cost of analysis
- When there are bigger ROIs elsewhere
Complexity
- performance is complexity of systems
- in cloud computing, you may not even know which instance to look at first
- cascading failure
- one failed component causes performance issues in others
- bottlenecks
- complex characteristic of the production workload
- multiple causes
- multiple performance issues
Observability
understanding a system through observation
use tools to understand it:
- counters
- operation counts
- metrics
- a statistic that has been selected to evaluate or monitor a target
- profiling
- use of tools that perform sampling
- tracing
- event-based recording
- …
Methodologies
Terminology
- IOPS
- Throughput
- Response time
- Latency
- Utilization
- describe device usage
- Time-Based
- Capacity-Based
- Saturation
- which more work is requested of a resource than it can process
- Bottleneck
- Workload
- Cache
- Cold
- Warm
- Hot
- Warmth
Concepts
Latency
Latency is a measure of time spent waiting
- Latency is a metric
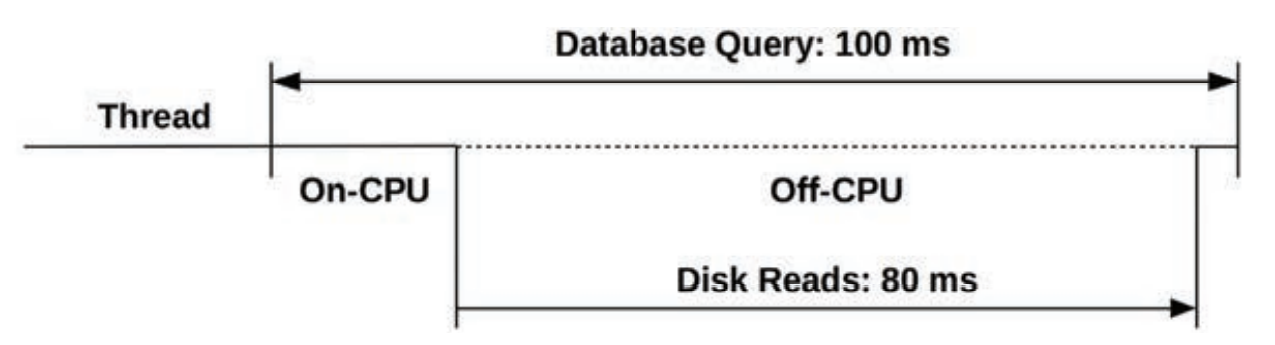
latency can allow maximum speedup to be estimated: disk reads are causing the query to run up to 5x more slowly.
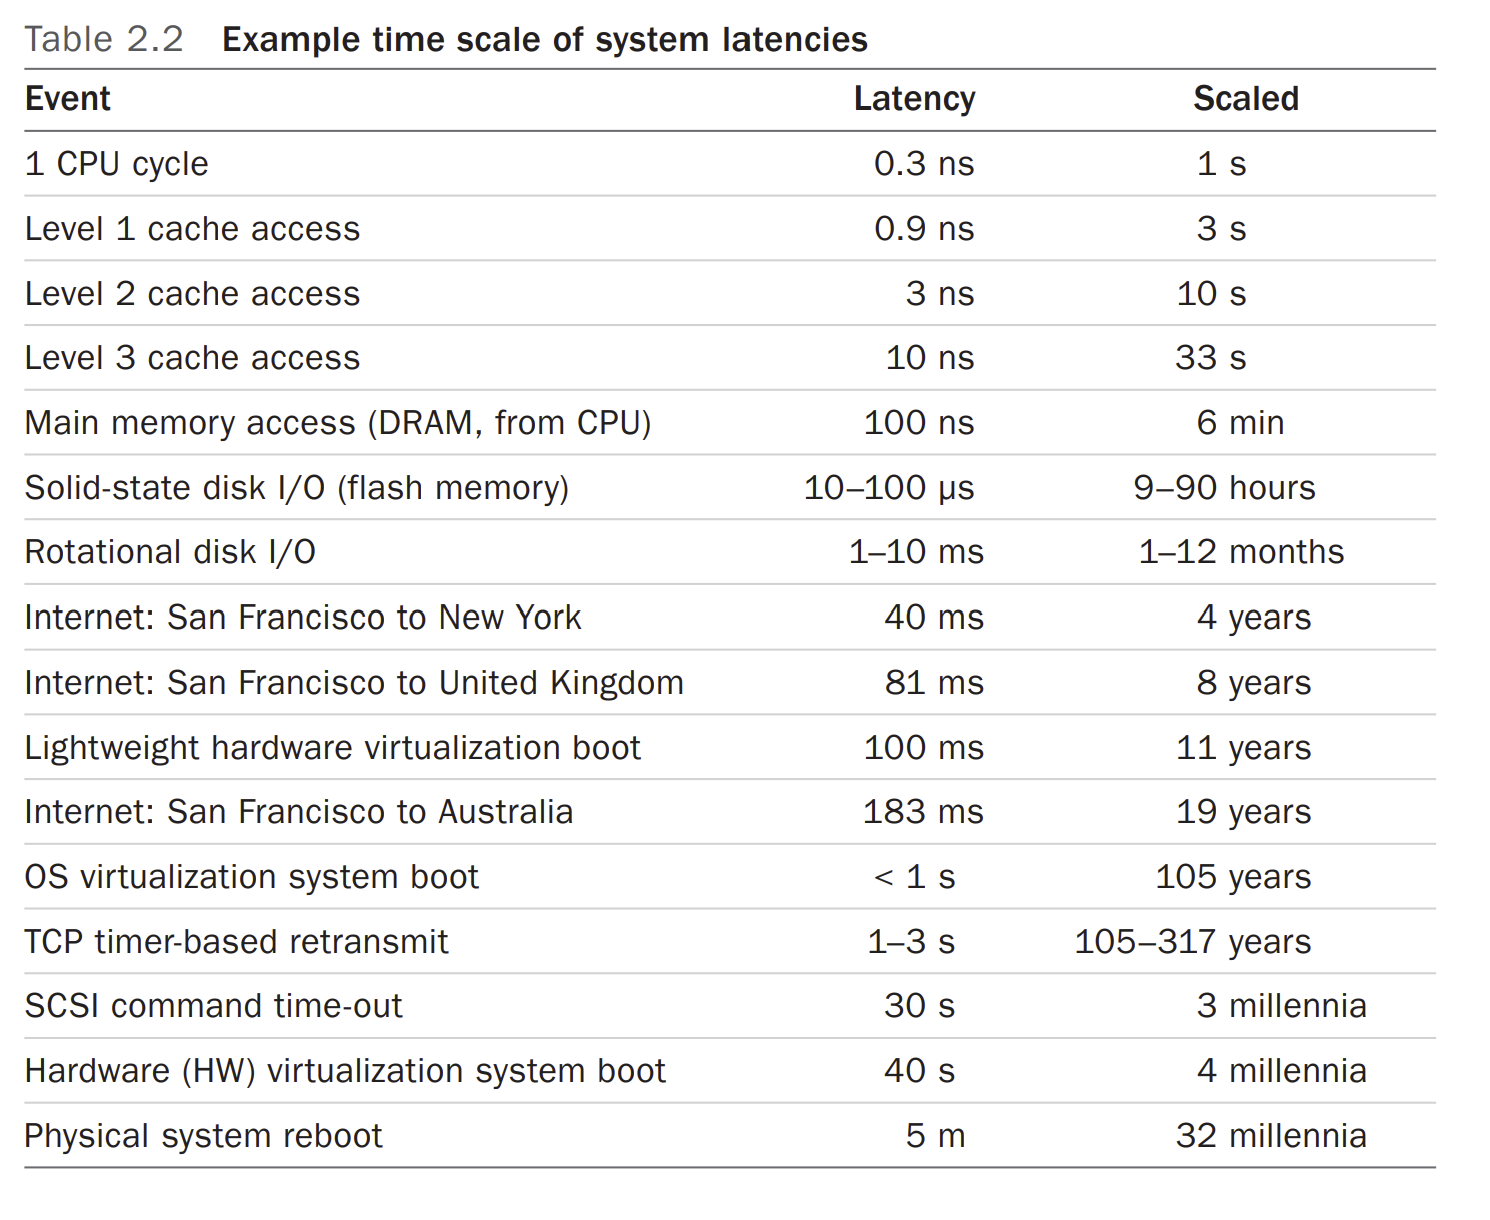
Time Scales
it helps to have an instinct about time, and reasonable expectations for latency from different sourses.
Tuning Efforts
tuning can eliminate the setting value
| Layer | Example Tuning Targets |
|---|---|
| Application | Application logic, request queue sizes, database queries performed |
| Database | Database table layout, indexes, buffering |
| System calls | Memory-mapped or read/write, sync or async I/O flags |
| File system | Record size, cache size, file system tunables, journaling |
| Storage | RAID level, number and type of disks, storage tunables |
Level of Appropriatence
Different organizations and environments have different requirements for performance.
Load vs Architecture
An application can perform badly due to an issue with the software configuration and hardware on which it is running. However, an application can also
perform badly simply due to too much load being applied, resulting in queueing and long latencies.
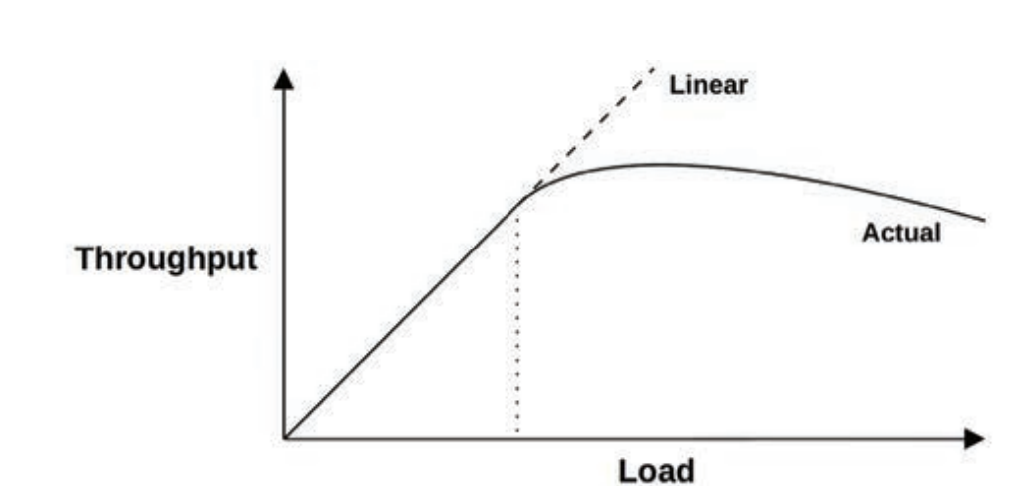
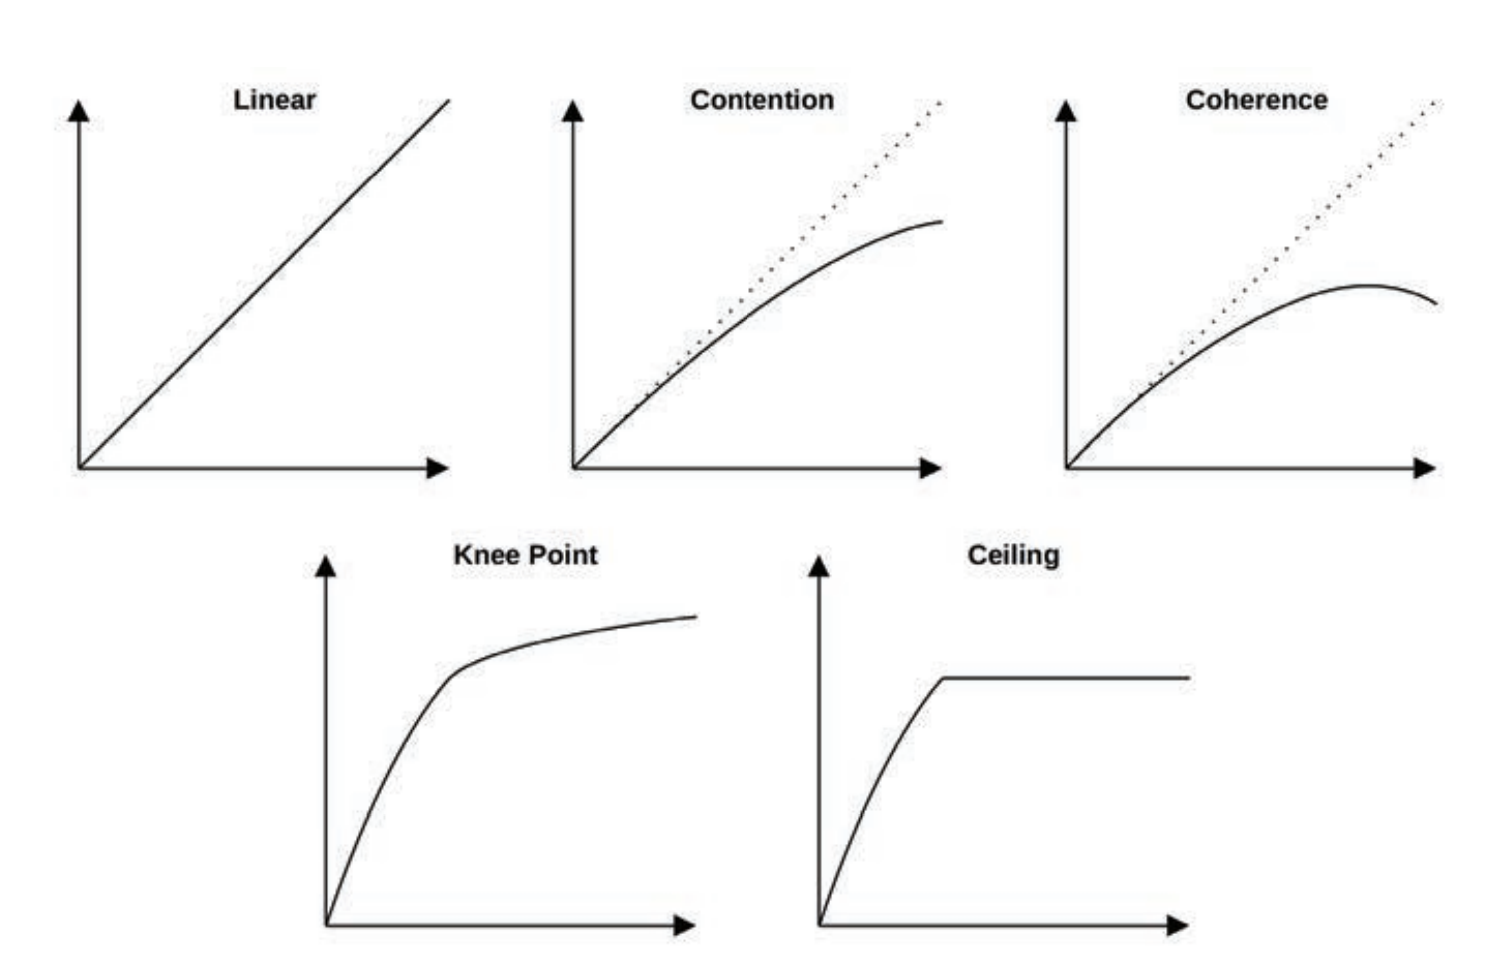
Salability
The performance of the system under increasing load is its scalability.
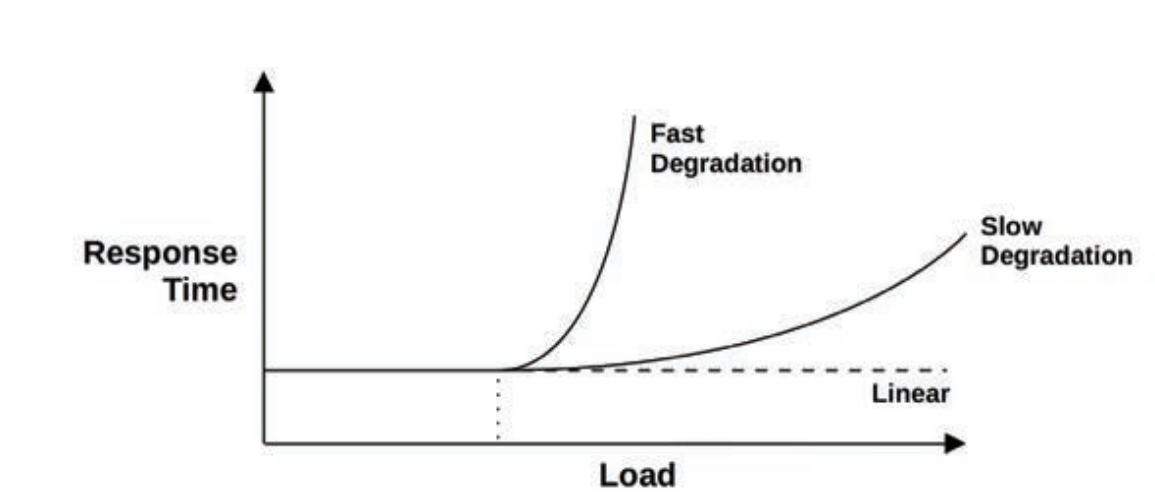
The degradation of performance for nonlinear scalability, in terms of average response time or
latency.
Metrics
Performance metrics are selected statistics generated by the system.
- Throughput
- IOPS
- Utilization
- Latency
Utilization
- Time-based utilization is formally defined in queueing theory
- : U = utilization, B = total time the system was busy during T
- Capacity-Based
- 100% busy does not mean 100% capacity
- 100% utilization cannot accept any more work.
Saturation
The degree to which more work is requested of a resource than it can process is saturation. Saturation begins to occur at 100% utilization (capacity-based), as extra work cannot be processed and begins to queue.
Poriling
Profiling builds a picture of a target that can be studied and understood. profiling is typically performed by sampling the state of the system at timed intervals and then studying the set of samples.
CPUs are a common profiling target
Known Unknowns
- Known-knowns
- Known-unknowns
- Unknown-unknowns
Performance is a field where “the more you know, the more you don’t know.”
Methodology
| Methodology | Type |
|---|---|
| Streetlight anti-method | Observational analysis |
| Random change anti-method | Experimental analysis |
| Blame-someone-else anti-method | Hypothetical analysis |
| Ad hoc checklist method | Observational and experimental analysis |
| Problem statement | Information gathering |
| Scientific method | Observational analysis |
| Diagnosis cycle | Analysis life cycle |
| Tools method | Observational analysis |
| USE method | Observational analysis |
| RED method | Observational analysis |
| Workload characterization | Observational analysis, capacity planning |
| Drill-down analysis | Observational analysis |
| Latency analysis | Observational analysis |
| Method R | Observational analysis |
| Event tracing | Observational analysis |
| Baseline statistics | Observational analysis |
| Static performance tuning | Observational analysis, capacity planning |
| Cache tuning | Observational analysis, tuning |
| Micro-benchmarking | Experimental analysis |
| Performance mantras | Tuning |
| Queueing theory | Statistical analysis, capacity planning |
| Capacity planning | Capacity planning, tuning |
| Quantifying performance gains | Statistical analysis |
| Performance monitoring | Observational analysis, capacity planning |
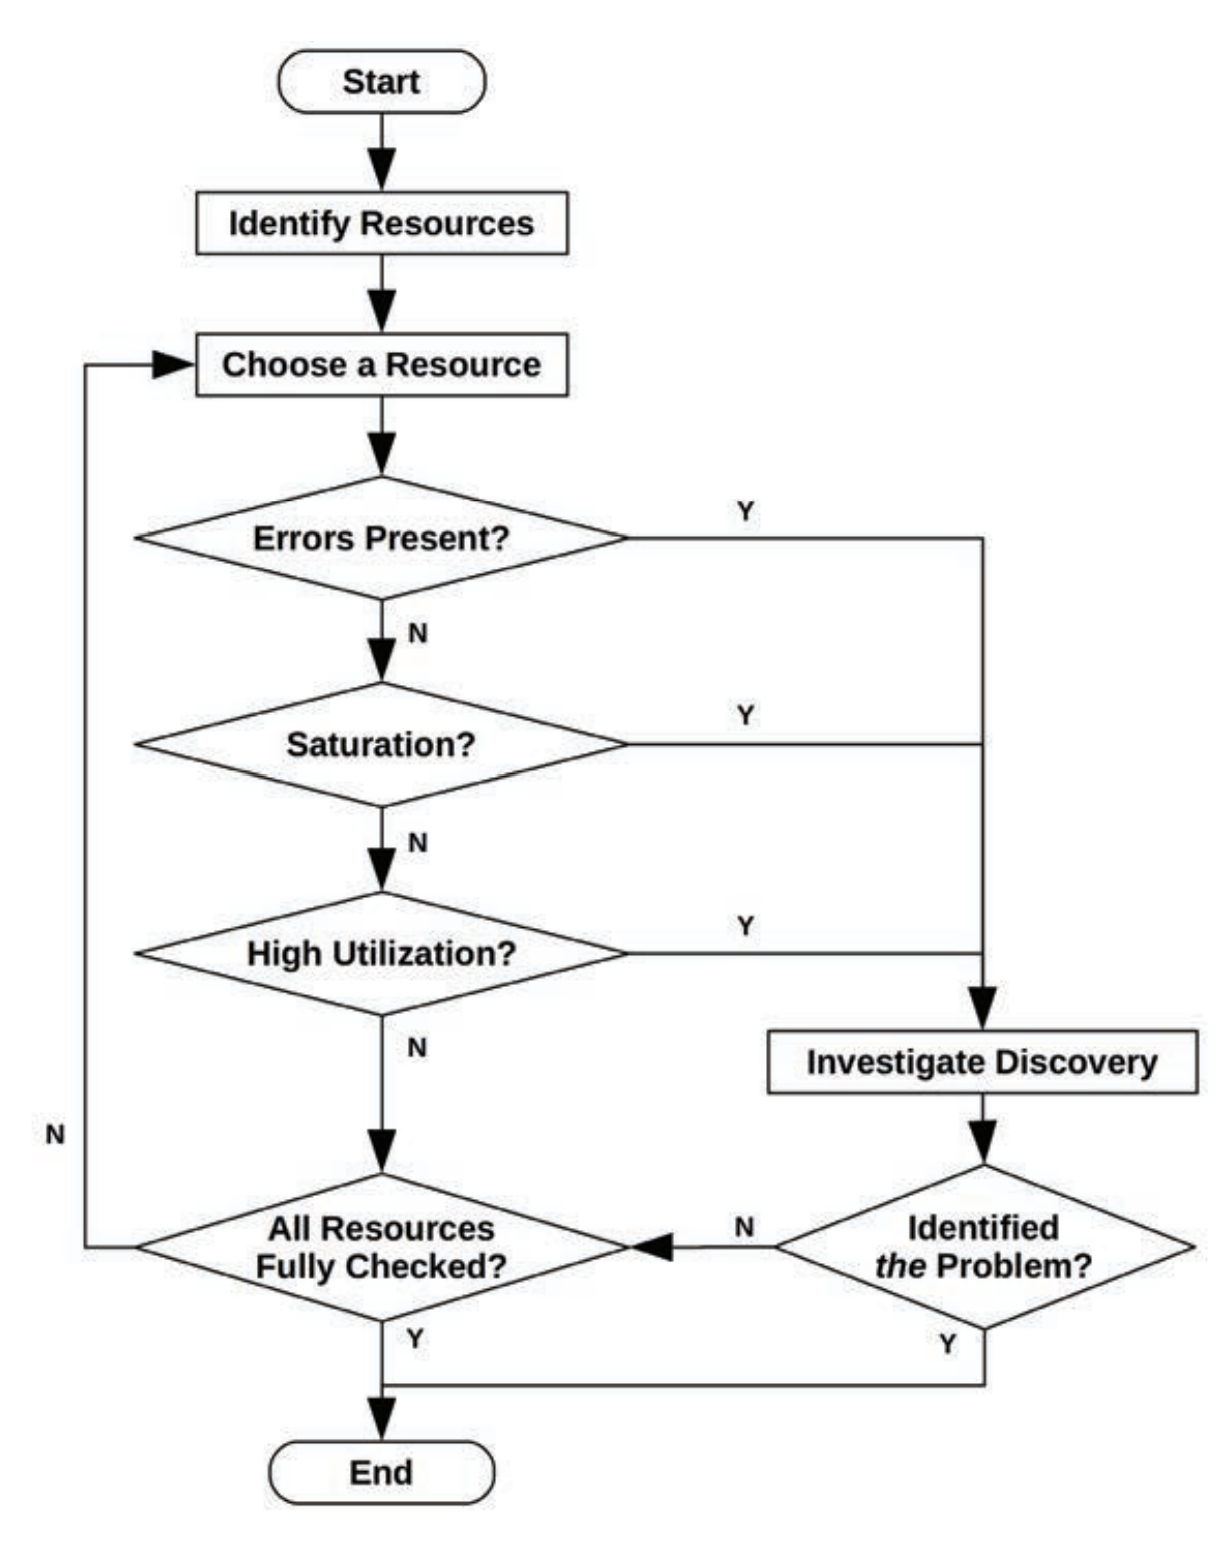
USE Method
The utilization, saturation, and errors (USE) method should be used early in a performance
investigation to identify systemic bottlenecks.
- Resources: All physical server functional components (CPUs, buses, . . .). Some software
resources can also be examined, provided that the metrics make sense - Utilization: For a set time interval, the percentage of time that the resource was busy
servicing work. While busy, the resource may still be able to accept more work; the degree
to which it cannot do so is identified by saturation. - Saturation: The degree to which the resource has extra work that it can’t service, often
waiting on a queue. Another term for this is pressure. - Errors: The count of error events
-
Resource List
- CPUs
- Main memory
- Network interfaces
- Storage devices
- Accelerators
- Controllers
- Interconnects
-
Software Resource
- Mutex lock
- Thread pools
- Process/thread capacity
- File descriptor capacity
RED Method
Typically used in cloud services in a microservice architecture.
For every service, check the request rate, errors, and duration
- Request rate: The number of service requests per second
- Errors: The number of requests that failed
- Duration: The time for requests to complete
draw a diagram of your microservice architecture and ensure that these three
metrics are monitored for each servic
Latency Analysis
breaks it into smaller components, continuing to subdivide the components with the highest latency so that the root cause can be identified and quantified. S
Example: analysis of MySQL query latency
- Is there a query latency issue?
- Is the query time largely spent on-CPU or waiting off-CPU?
- What is the off-CPU time spent waiting for? (file system I/O)
- Is the file system I/O time due to disk I/O or lock contention? (disk I/O)
- Is the disk I/O time mostly spent queueing or servicing the I/O? (servicing)
- Is the disk service time mostly I/O initialization or data transfer? (data transfer)

Other Method
- Streetlight Abti-Method
- Random Change Abti-Method
- Blame Someone Else Abti-Method
- Ada Hoc Checklist Method
- Scientific Method
- Tools Method
- Method R
Models
System Under Test
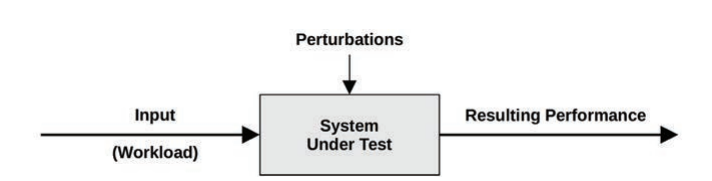
be aware that perturbations (interference) can affect results
Queueing System
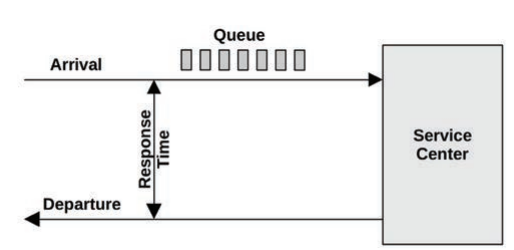
Visual identification
Applications
Applications Basic
- Function
- Operation
- Performance requirements
- CPU mode
- Configuration
- Host
- Metrics
- Logs
- Version
- Bugs
- Source code
- Community
Objectives
- Latency
- Throughput
- Resource utilization
- Price
Applications Performance
- Selecting an I/O size
- Caching
- Buffering
- Polling
- Concurrency & Parallelism
- Non-Blocking I/O
- Processor Binding
- Performance Mantras
- Don’t do it.
- Do it, but don’t do it again.
- Do it less.
- Do it later.
- Do it when they’re not looking.
- Do it concurrently.
- Do it cheaper
Refer Book if need
- OS
- CPU
- Memery
- File System
- Disks
- Network
- Benchmarking
- Ftrace
- BPF
Reference
- Systems.Performance.Enterprise.and.the.Cloud.2nd.Edition.2020.12